 |
|
Latest News:
OOTP 26 Available
- FHM 11 Available
- OOTP Go! Available
Out of the Park Baseball 26 Buy Now! |

|
|
||||
| ||||
|
|||||||
| OOTP 21 - Historical Simulations Discuss historical simulations and their results in this forum. |
 |
|
|
Thread Tools |
 01-06-2021, 08:12 AM
|
#1 |
|
Minors (Double A)
Join Date: Nov 2020
Location: T�k�l, Hungary
Posts: 193
|
Interesting stats
Hi,
Again some issue with historical stats. Is it sure that GIDP is correctly implemented in case of a historical game?  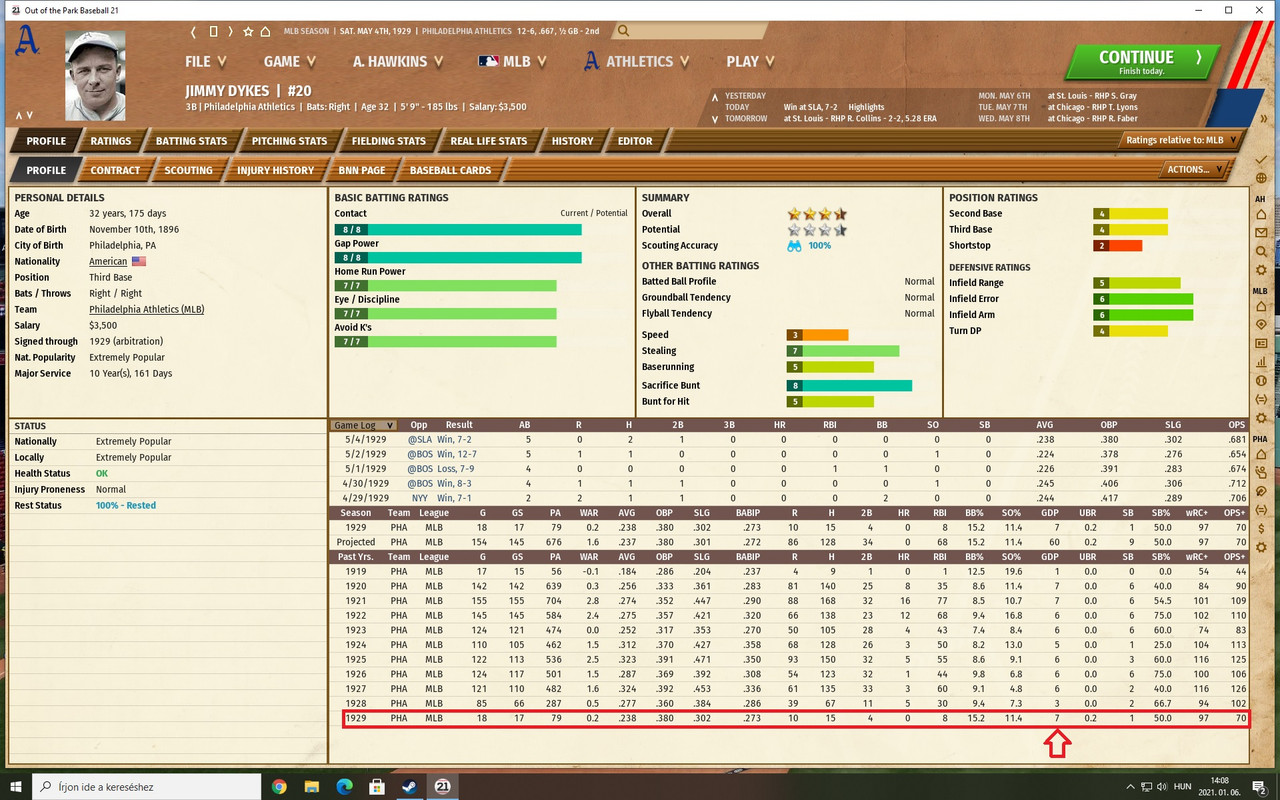 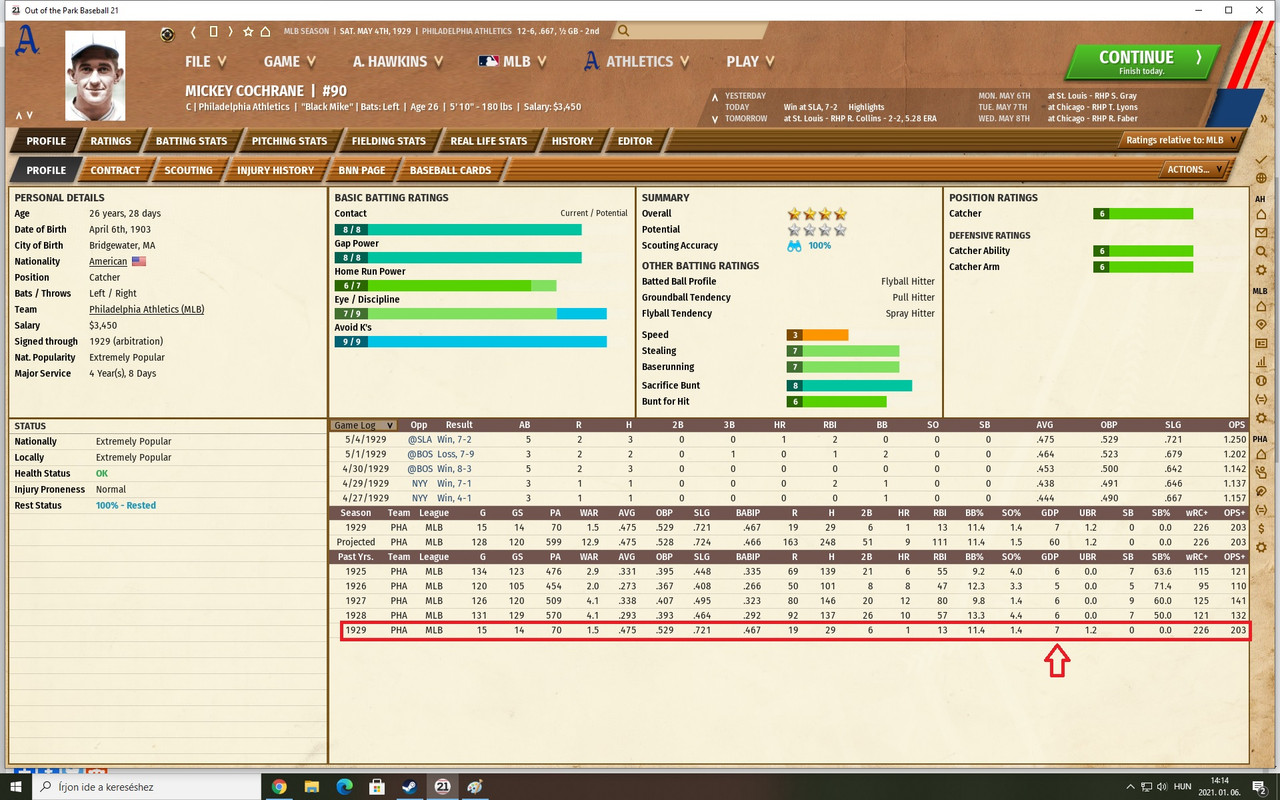
Last edited by Andrej72; 01-06-2021 at 08:17 AM. |

|

|
|
01-06-2021, 08:37 AM
|
#2 |
|
Hall Of Famer
Join Date: Jun 2004
Posts: 4,255
|
There is a league totals modifier specifically for GIDP. I have never noticed any problems with this. I am not sure how you have so many GIDP from those two players so early in the season.
Last edited by Garlon; 01-06-2021 at 08:40 AM. |
|
|
|
|
01-06-2021, 08:52 AM
|
#3 |
|
Minors (Double A)
Join Date: Nov 2020
Location: T�k�l, Hungary
Posts: 193
|
Is there any modifier that is set incorrectly?
|
|
|
|
|
01-06-2021, 09:19 AM
|
#4 |
|
Hall Of Famer
Join Date: Jun 2004
Posts: 4,255
|
The modifiers will calculate automatically before the season begins.
|
|
|
|
|
01-06-2021, 09:58 AM
|
#5 |
|
Hall Of Famer
Join Date: Jun 2011
Posts: 3,706
|
Are you running a 1929 replay? The problem might simply be with your small sample size. The average AL team had 150 double plays during the 1929 season, so roughly one per game. 14 DPs in 18 games, then, wouldn't be too surprising, except for the fact that only two players were responsible for all of them. Have you played out the entire season?
We don't have GIDP stats for that year,so I don't know how OOTP calculates that for individual players. Cochrane was slow, so that might explain why he's grounding into double plays. Not too sure what's up with Dykes - he was speedy and had some pop in his bat. Maybe his problem is that he was batting with slowpokes like Cochrane and Mule Haas on base. |
|
|
|
|
01-06-2021, 10:08 AM
|
#6 |
|
Hall Of Famer
Join Date: Jun 2004
Posts: 4,255
|
Even though we do not have GIDP for that season, we do have total DP and the file uses an estimate of GIDP from the total DP for those seasons.
|
|
|
|
|
01-06-2021, 11:31 AM
|
#7 | |
|
Hall Of Famer
Join Date: Jun 2011
Posts: 3,706
|
Quote:
|
|
|
|
|
|
01-06-2021, 11:48 AM
|
#8 |
|
Hall Of Famer
Join Date: Jun 2004
Posts: 4,255
|
I do not know how OOTP handles GIDP with relationship to those ratings.
|
|
|
|
|
01-06-2021, 11:56 AM
|
#9 | |
|
Minors (Double A)
Join Date: Nov 2020
Location: T�k�l, Hungary
Posts: 193
|
Quote:
Last edited by Andrej72; 01-06-2021 at 03:16 PM. |
|
|
|
|
|
01-06-2021, 07:54 PM
|
#10 | |
|
Hall Of Famer
Join Date: Jun 2011
Posts: 3,706
|
Quote:
And you should be seeing fewer DPs in 1910. They turned fewer DPs back in the deadball era. |
|
|
|
|
|
01-07-2021, 01:52 PM
|
#11 |
|
Hall Of Famer
Join Date: May 2006
Posts: 3,640
|
Normally, small sample size is a valid point. But, in this case, it amplifies the severity of the problem. These are two players who have already exceeded their GDP totals from seasons where they had over 500 plate appearances, but they have done it in only 70 PAs. Unless they only ground into a few double plays for the rest of the season, their stats are going to end up well beyond the range of standard statistical deviation.
Both of these players are rated as quite slow, so OOTP is obviously punishing them. But double plays have as much to do with the baserunner on first base than the person doing the batting. Who is hitting ahead of these players in the lineup, and how often are these batters coming to the plate with a really slow and/or bad baserunner at first base? That could be affecting some of these results. |
|
|
|
|
01-07-2021, 02:03 PM
|
#12 |
|
Hall Of Famer
Join Date: Jun 2004
Posts: 4,255
|
They may also be imbalances in turning double plays for some teams because of the fielding ratings issues.
|
|
|
|
|
01-07-2021, 05:25 PM
|
#13 | ||
|
Hall Of Famer
Join Date: Jun 2011
Posts: 3,706
|
Quote:
Quote:
The average AL team in 1929 turned 150 DPs in 154 games. Compare that to 2019, where the average MLB team turned 134 DPs in 162 games. So teams in '29 were actually more adept at turning DPs than teams in 2019. A big part of that was probably due to the fact that there were just so many baserunners, more than in 2019 (both because of the higher batting averages and because so much offense in 2019 is generated by HRs). The leaders in GIDP in 2019 were Jose Abreu and Manny Machado, who both had 24. So it really wouldn't be too surprising if a slow guy like Mickey Cochrane grounded into 20 or more DPs during the season, despite what OOTP shows as his "career stats." |
||
|
|
|
|
01-07-2021, 06:35 PM
|
#14 | |
|
Hall Of Famer
Join Date: May 2006
Posts: 3,640
|
Quote:
|
|
|
|
|
|
01-07-2021, 07:24 PM
|
#15 | |
|
Hall Of Famer
Join Date: Jun 2011
Posts: 3,706
|
Quote:
OOTP's estimates might be based on ratings, in which case it would make sense to predict that a player's GIDP numbers will remain relatively constant over time. But then maybe OOTP is just guessing, or basing the numbers on something other than the in-game ratings. Spritze, the guy who probably could have answered this question, is no longer with us. So I have no clue whether OOTP's pre-1933 GIDP estimates are something that the game should be reliably recreating or if they're just SWAGs. |
|
|
|
|
|
01-07-2021, 07:53 PM
|
#16 |
|
Hall Of Famer
Join Date: Jun 2004
Posts: 4,255
|
The teams in 1929 may have turned more double plays but I do not think they were more adept. In 2019 there were 8.9 K/9 and a .323 OBP and in 1929 there were 2.9 K/9 and a .353 OBP. Those strikeouts in 2019 reduce double play opportunities significantly and the OBP in 1929 greatly increase the opportunities.
There does not need to be any type of GIDP rating for batters. It is simply a matter of opportunity. The #3 and #4 batters are probably going to have more opportunities for GIDP than the #1 batter who can never get a GIDP leading off the game and has fewer opportunities because the bottom of the order will be on base less frequently too. |
|
|
|
|
01-07-2021, 08:53 PM
|
#17 | ||
|
Hall Of Famer
Join Date: Jun 2011
Posts: 3,706
|
Quote:
 You make good points, but when the NL started compiling GIDP stats in 1933, the league leader had 26. Granted, it was Ernie Lombardi, reputedly one of the slowest men ever to play the game, but seven other players had 20 or more GIDPs and the average for 600 PA was 14 GIDPs. So again, I'd be surprised if a player like Mickey Cochrane had only six or seven GIDPs in 1929. Quote:
|
||
|
|
|
|
01-08-2021, 07:08 AM
|
#18 |
|
Hall Of Famer
Join Date: Jun 2004
Posts: 4,255
|
Apparently the GIDP values were added so they were not showing up as 0 for all players. At some point those values were probably added to the database with a generic formula like (AB - H - K)/50 or something, possibly not even with regard to the double play totals in those seasons.
|
|
|
|
|
| Bookmarks |
|
|


