|
|
Latest News:
OOTP 25 Available
- FHM 10 Available
- OOTP Go! Available
Out of the Park Baseball 25 Buy Now! |

|
|
||||
| ||||
|
|||||||
| OOTP Mods Logos, roster packs, historical databases, OOTP tools, FaceGen files... it's all here! |
 |
|
|
Thread Tools |
 11-13-2007, 02:09 PM
|
#22 |
|
All Star Starter
Join Date: Jan 2003
Location: Milwaukee, WI
Posts: 1,553
|
This is definitely looking up so far.

__________________
Uniforms compatible with OOTP23/24 Historical Major League Baseball 1901-current Historical Major League Baseball 1871-1900 Historical Federal League Historical Negro Leagues |

|

|
|
11-13-2007, 02:32 PM
|
#23 |
|
All Star Reserve
Join Date: Aug 2003
Location: Spain
Posts: 703
|
Excellent job!
Please start a thread in the beta forum (Transactions and AI subforum) with this stuff so it won't be forgotten. I hope Markus can implement it in the next version.
__________________

|
|
|
|
|
11-13-2007, 03:14 PM
|
#24 |
|
Hall Of Famer
|
Umm...I posted it in one of the other forums (Game Engine) there. What information should I put in that particular subforum?
__________________
Godfather of Fast-Sim OOTP My Mods: GMExcel 24 Major League Women's Baseball (OOTP24) quickstart Indian Premier League | 300+ years of baseball quickstart | Expatriate League quickstart | Off-Field Injuries Update | Women's Name File for OOTP | My (outdated) market calculator & financial spreadsheets |
|
|
|
|
11-13-2007, 03:48 PM
|
#25 | |
|
All Star Reserve
Join Date: Aug 2003
Location: Spain
Posts: 703
|
Quote:
__________________
|
|
|
|
|
|
11-28-2007, 02:20 AM
|
#26 | |
|
Hall Of Famer
|
Version 4.0
CHANGES
Quote:
The new TRADE VALUE CALCULATOR is the most dramatic of these tools. It gives you a model to assess a trade from 1-5 players to you and the computer (I don't attempt to account for three-team deals, since the game doesn't support them..but you can still cultivate them more fairly using this tool..) Basically, it takes VORP and player overall rating (on a 20-80 scale) and assigns a value to the player and if the scales are tipped too far in your favour, it tells you by how much (in a cash amount) the deal is off by. You could attempt to add that much cash to cover the deal, but...realistically, it just means you ought to add a player of closer value to close the gap on the deal and that amount is just to give you an idea of how much of a value you're getting. It doesn't take into account payrolls and such alike, because it figures that's something for you and your league to worry about. And that way, it allows you to use the tool with any era and with any generation of players, which I thought would be handy. DC'S SUPERSTAR NEGOTIATOR is something that I'm trying to cultivate as a separate tool like the trade value calculator, but for now it relies on values from the spreadsheet to make it work. The assumptions are in modern-day dollars, so it wouldn't be useful for a past-era unless you changed all of the formulas. The idea is to simulate other GMs bidding on a favourite player of yours each off-season. We're talking a star player that you're trying to sign. The notion is, if a team isn't doing as well, they're going to be more likely to consider making a splash to sign said player, providing that they have a need for them. So how you'd use it, is find 1-5 other teams that are interesting the same player you are, then input the values from their part of the spreadsheet and then it will come up with a contract amount that those teams would pay said player. Then in the game once the player signs, you give him that deal that the negotiator decided on. If it's one of the other teams, same situation, you follow the negotiator. The idea is to take some of the mystery out of things and yet, adding some sort of realism that I think the game seems to flub up a bit related to contracts for stars in the game and the lack of real bidding wars except on occasion. That's pretty much it. Well, I need to explain some other stuff. But I'm still not convinced anyone even uses this. So...I won't go there yet. But I might, provided there is a desire by people to have me do that. |
|
|
|
|
|
11-29-2007, 08:48 PM
|
#27 |
|
Hall Of Famer
|
I'm working on a streamlined version of this model that will allow you to simply input information for your own team only and then to be able to play each year with just that and to let the rest of the league do what it does.
I'm not sure how to make it adaptable so that you can alter it for different types of financial models, it'll basically model real life financials the way I'm devising it now.
__________________
Godfather of Fast-Sim OOTP My Mods: GMExcel 24 Major League Women's Baseball (OOTP24) quickstart Indian Premier League | 300+ years of baseball quickstart | Expatriate League quickstart | Off-Field Injuries Update | Women's Name File for OOTP | My (outdated) market calculator & financial spreadsheets Last edited by darkcloud4579; 12-02-2007 at 03:01 AM. |
|
|
|
|
12-07-2007, 04:24 PM
|
#28 | |
|
Hall Of Famer
|
Express Financial Model
In addition to DCCash, a modified version of my financial spreadsheet that will take you no more than 5 minutes to do and be ready to play each season. The other module is called DCTicketPrice, which you need to have in order to complete the DC Cash spreadsheet.
Here's the express financial model. It's pretty sweet. It'll save you a ton of time and you can use it only for your team. It's especially helpful when running a small-market club, because then you can use it to model how much money your club truly has, depending on the size of your small market. Here are the variables: TEAM CITY: Where your team is located. MARKET POP.: Your market population. Includes the metropolitan statistical area nearby and any other areas within 300 miles or so, that you claim within your market, so long as they are not part of another team's market. If so, adjust that number. TICKET PRICES: Use the amount calculated from DCTicketPrice in this variable here. CY WINS: Current Year wins LY WINS: Last year wins PLAYOFFS: Enter a 1 if your team makes the playoffs, a 2 if you make it to the LCS and 2nd round of the playoffs and a 3 if you make the World Series or final round of your league. WS TITLE: Enter a 4 if your team wins the league title/world series MEDIA TYPE: Media Types: (includes media sponsorship) Quote:
EXPANSION: Enter a 1 if your team is in its first 2 years of expansion franchise-dom and a 0 if not. --- THAT'S IT! The rest of the formulas are completed automatically!! Your media deal should stay the same for five years, so you shouldn't change it each year and you ought to complete this spreadsheet at the end of the playoffs each year. --- The Orange section of the spreadsheet are for OOTP. The fan interest number goes into your fan interest area of the game. Fan interest modifier is the same. (I'm working on a way to model when your team signs a new player that gives you a 'boost' in fan interest. But not in this particular version.) Code:
FAN LOYALTY: Enter this into that area in the game. MARKET SIZE: Same deal. LY MERCH: Last year's merchandising income MEDIA DEAL: Total media contract plus sponsorships. Do NOT enter this into the game's media contract area. MEDIA RTY: Enter this amount (it's the amount of your media deal each year for five years) into the media contract area and media revenue last year box and put 5 years as the total number of years. You never have to mess with it again. Until 5 years are up. CASH: Enter this into the cash area in the game. Avail Budget: This goes into the budget area in the game. Last edited by darkcloud4579; 12-07-2007 at 07:17 PM. |
|
|
|
|
|
12-07-2007, 06:39 PM
|
#29 |
|
Hall Of Famer
|
The next thing I plan to do is to create an accompanying sheet that will allow you to map out your team's budget over 5 years, to figure out how much money you have each year, so you can adapt your budget accordingly, rather than basically operating with a semi-limitless supply of cash each year or at least, a large chunk.
Basically, if you spend $70m in years 1-4, you shouldn't have $100m to spend the following years unless your team budget can sustain that. I'd like to account for that better without making things more complicated. |
|
|
|
|
12-07-2007, 07:35 PM
|
#30 |
|
Hall Of Famer
|
Mission Accomplished.
New areas:
I added new areas already, so sorry to pull the old one so quick with updates. But I figure with how it's done now, it ought to be a pretty good working tool that you can test out all weekend and report back with how it worked for you (yeah, right..) I've designed the sheet to be used just for your team. There is a 2nd team area in there, but it's mostly to show you how it would work for a behemoth like the Yankees. The top spot is for your ballclub. Below the stats, there is an entire area for your 25-man roster. List those players (and any bonus babies if you're into that...) on that particular sheet and map out your salaries over the next five years. In addition, I have an area for "player development budget" And how that ought to work is like this. OOTP doesn't do a bang up job in the scouting department and so I'll leave how those players arrive to your team up to you (whether you go out to find, them, etc., ) and obvious, the money you spend won't necessarily correlate with success. But how I've set it up, is that the available cash you've generated, will pay for that player development system of yours each year. It shouldn't leave you with tons of money to spend in trades, which is done on purpose if you're a small market club. You do get more money added to your cash, based on how much merchandise you sold the previous year, so you'll still be okay. According to Diamond Dollar$, it can cost an effective franchise about $25-30 million to draft and develop good talent over time, where as a team that purchases it might get the same yield by spending about $75 million in free agency. So by that standard, spending less than that $25 million threshold in present-day dollars, will not necessarily result in the same sort of bound of say, the Minnesota Twins or Oakland A's success on a budget and if it does, it's either because you're cheating, your draft players are tweaked too high or you're just plum lucky. And it's your game, do whatever you want... I rennamed DCCash, DCMarketModel. Just because it's more accurate that way. But all in all, I think you'll find with the new model that it's the most effective tool out there for simulating more realistic finances than what the game produces. So long as you adhere to it and don't worry about what the game is doing, I imagine that it can be a challenge for you for as long as you choose to play. As always C/C are welcomed. |
|
|
|
|
12-07-2007, 09:54 PM
|
#31 |
|
Hall Of Famer
|
Apparently, baseline revenue is affected by market size and so, I'll need to modify the next formula to include that. I've also worked on some other additions that I intend to test out in my own dynasty for a few years before releasing it. These include measurements of "player value" which impact Fan Interest Modifiers, as well as merchandising and ticket revenues.
__________________
Godfather of Fast-Sim OOTP My Mods: GMExcel 24 Major League Women's Baseball (OOTP24) quickstart Indian Premier League | 300+ years of baseball quickstart | Expatriate League quickstart | Off-Field Injuries Update | Women's Name File for OOTP | My (outdated) market calculator & financial spreadsheets |
|
|
|
|
12-07-2007, 10:08 PM
|
#32 |
|
Hall Of Famer
|
Be sure when doing market sizes in cities with more than one team to divide the market properly or else, you'll get ridiculous setups. Mostly in New York, but...in two or three-team cities, dividing up the market appropriately can make things a lot easier to swallow.
__________________
Godfather of Fast-Sim OOTP My Mods: GMExcel 24 Major League Women's Baseball (OOTP24) quickstart Indian Premier League | 300+ years of baseball quickstart | Expatriate League quickstart | Off-Field Injuries Update | Women's Name File for OOTP | My (outdated) market calculator & financial spreadsheets |
|
|
|
|
12-08-2007, 06:36 PM
|
#33 |
|
Hall Of Famer
|
Another tip that I just figured out is...rather than using that entire player spreadsheet to map out who you have and who you don't have, you could simply input how much your opening day or end of season budget is each year into the total payroll box. It'll replace the formula there that is designed to add up all of the salary cells above them, but what's helpful about that is, you can basically map out how much payroll your team can sustain over a five-year period.
So that's way more helpful than having it simply map out payroll of players as you put it in. Here's an example of what I did... 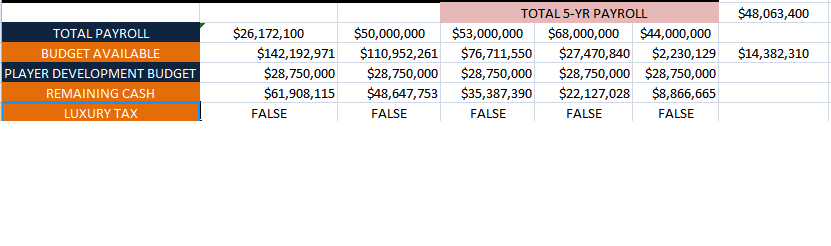 The first year's payroll for my Omaha club is $26.1 million. Rather than just look at the payroll as it currently is mapped to be (current contracts) in future years, I replaced those years with what I projected payroll to be (in my head) and while I'm not going to follow that methodology, what's nice about it...is that if you decide that your team wants to "go for it" over a particular period of time, you can map out what couple of years you'll "go for it" and then when you have to bring things back to earth. Of course, after five years, you can change your media deal. So maybe there are benefits involved in it, who knows? Just a new trick I learned and wanted to share. I'm constantly updating the original one I use, so if some of the fields I have are different than what you have (Luxury Tax among them) don't worry...it doesn't affect anything you do, but I did want to add that for future releases, basically lowers the amount of available cash that teams who spend over a certain amount (I believe it's set to $90 million) by charging them a luxury tax. If you do end up doing it for your whole league, that can be a handy tool. |
|
|
|
|
12-08-2007, 11:06 PM
|
#34 |
|
Hall Of Famer
|
More lessons.
Using the attached 2007-08 DMA ranks (tv market ratings) from Nielsens, to create a more "accurate" market size, you ought to divide not just the regional populations of your market, but also add the TV market as part of that market. What it'll do for smaller market teams is, allow you to create a mechanism by which your team can actually generate revenues that otherwise would be off-limits with just factoring the "people" population of a particular area. I did this and the results to me were far more "realistic" in terms of what the teams generated in revenue. See what you think of that... |
|
|
|
|
12-25-2007, 01:30 AM
|
#35 |
|
Hall Of Famer
|
I've completed a new version of the model and it's the best one yet. It's not only simple, it's most optimal for OOTP now than ever before.
One of the things you can do with the new model is to see how a team -- with its current performance -- would do in a bigger market. For instance, I took the Royals with their current payroll and performance factors and they're losing about $27 million this year and so, if they kept at that pace and failed to start winning and kept spending..they'd still be in that same quagmire. But if you put them in a bigger market -- even if they were losing -- it might show you something. Presuming that attendance would rise in said market, it gives you a good indication when a team is just doing awful and needs to cut it out. The best part of the new model (and I'll test this out before I release it) is that I think if you use it to run a solo league, that I think you'll find it induces teams to act more realistically when they spend. That's what prompted me to do this thing in the first place. I was tired of seeing teams in a non-revenue sharing balanced league spending recklessly for no real rhyme or reason and sure, I could mimic that it was some rich owner..but it defied real life for me and it was hard to watch. If it works the way I intend it, then I'll release it to you all. But what a christmas present for myself to find out that this might actually work the way I originally intended without being massively complex! Best of all, it won't require you to make tons of massive changes each year. Though anyone even investigating this won't mind investing the time, because it means that they get a more realistic gaming experience. So I'll test it out and then we'll see if it's real for you all. |
|
|
|
|
12-25-2007, 06:42 PM
|
#36 |
|
Hall Of Famer
|
Ok, so I've tested this out using real life information and it looks really good. I've inputted the data into an MLB-type universe (it's the 2007 Lahman database) and what I'll do is, run a few seasons to see how much OOTP attempts to change the values that I inputted.
The idea is for things to stay relatively attempt consistent as the teams performances change. In other words, the Yankees shouldn't miraculously lose all of their buying power and become paupers to the Kansas City Royals, because that doesn't make any freakin' sense using baseball's current economic system. So I want to see how well the game handles the data I inputted. If it works well, then we'll know we're onto something. |
|
|
|
|
12-25-2007, 08:19 PM
|
#37 |
|
Hall Of Famer
|
It works. I've run about half a decade already (I'm going to test 10 years total) and basically, you can input all of the information one time and you never have to touch it again. OOTP will run the league based on the information you've inputted. Fan interest and such will flucuate and all, but by and large..it runs great. So the dominant market teams still have a huge advantage financially, but it doesn't impact the ability of other teams to compete in the landscape, which was my hope to be honest.
So no more tweaking or seasons of tedium. I finally figured out -- on Christmas -- how to make the financial model work as I originally intended! |
|
|
|
|
12-25-2007, 08:37 PM
|
#38 |
|
Hall Of Famer
Join Date: Jan 2003
Location: Frankfort, Kentucky
Posts: 3,739
|
This is huge. Will it be possible to post a mod file or csv file or something for all the rest of us to import for real teams and a much better front office experience?
__________________
Charlie Root won more games for the Cubs than any pitcher (201), yet was remembered for one pitch to Babe Ruth. Find out more about the 1929 World Series in my book, "Root for the Cubs: Charlie Root and the 1929 Chicago Cubs." See the web site at www.rootforthecubs.com. The book is at http://www.amazon.com/Root-Cubs-Char...t+for+the+cubs. Beta tester, OOTP 2007-2023 and iOOTP 2011-2014. |
|
|
|
|
12-25-2007, 09:34 PM
|
#39 | |
|
Hall Of Famer
|
Quote:
Once I analyze the data, then I can post the results and we'll know whether it works or if I need to go back and make some tweaks to compensate for flaws in the way the AI works with money in the game. Glad there is interest!
__________________
Godfather of Fast-Sim OOTP My Mods: GMExcel 24 Major League Women's Baseball (OOTP24) quickstart Indian Premier League | 300+ years of baseball quickstart | Expatriate League quickstart | Off-Field Injuries Update | Women's Name File for OOTP | My (outdated) market calculator & financial spreadsheets |
|
|
|
|
|
12-25-2007, 11:37 PM
|
#40 |
|
Hall Of Famer
|
I'm going to spend some time pouring over the data because it'll help me understand things better. But one thing to note so far is that over the ten season span I simulated (2008-2017) only four teams failed to make playoffs over that time (Toronto, Minnesota, St. Louis and Seattle) and of those teams, only Seattle came into the first season when I put things together with actual financial problems (they were about $12 million in the hole cashwise) but that got wiped out because for the first two years I screwed up and OOTP got rid of everyone's cash and so I had to put it back in for Year 3. (Didn't have an appreciable effect and so I opted not to start over..)
But anyway...the point is, there is some measure of parity of that many teams -- all of whom remained in the same cities and with no human intervention -- were able to find some measure of success over that time. Also, 14 different teams made the World Series over the span and there were only two repeat champions (Texas and Colorado) and the AL was still dominated by the Yankees and Red Sox (though neither won a title in the span, but five pennants among them, Texas won two), the National League only had one repeat pennant winner during the span (Philadelphia) and a host of small market teams made appearances. What's great about this revelation is that money still stays where it "ought to" with the big market teams dominating in the total revenue/budget categories, but it doesn't assure them ridiculous amounts of success that the other teams can't at least participate, yet they still have an advantage and that's all I wanted...was for them to have the advantage that we all know they have in real life. I'm off to do some plotting, but I wanted to share that information for those who care. |
|
|
|
|
| Bookmarks |
| Thread Tools | |
|
|