 |
|
Latest News:
OOTP 25 Available
- FHM 10 Available
- OOTP Go! Available
Out of the Park Baseball 25 Buy Now! |

|
|
||||
| ||||
 10-29-2007, 02:23 AM
|
#1 |
|
Hall Of Famer
|
Dark Cloud's Financial Market Model Version 1.0
This is an issue that I've thought about for a long time, but it wasn't until RonCo pointed out the financial model for the FOBL on a different thread that got me thinking about this in an entirely different manner, so I'm grateful for that. I do use some elements of the structure of their formula to get this started, but my formula goes in a completely different direction and is geared towards the solo player trying to simulate a financial world that has some basis in real life.
What I've devised here, is a market model that rewards big markets for being in big markets. And it's not to say that great to good teams in smaller markets aren't rewarded here, as much as, they're hurt more if they don't have an owner with deep pockets AND fail to win over the course of time. And it's not wholly about celebrating big markets, since my particular example here is for a league I've just started and almost intentionally skews towards equitable revenue sharing and the model can easily be tweaked to accommodate whatever you're trying to do. I'll explain with more detail later what the variables of the 'sheet are, but I felt like it might be a helpful tool for those of us out there who are solo players who focus -- probably too much, if you're me -- on the financial and market-based aspects of the game. In all of my years of playing, I haven't seen a model that I've concocted outside of my brain that would better simulate a lot of what I'm trying to capture in my leagues, especially related to whether a team moves or stays where it is. This model accounts for a deep pocketed owner, attempts to create a salary floor by essentially MAKING teams spending some of their available income by discounting the average payroll number from that total and gives rewards to teams who are over .500, as well as other cash bonuses for playoff appearances and ticket increases (and access to higher paying ticket consumers) as the team wins, as well as factoring local media money and providing each team with a share of national media money. Like I said, I can break down the details later -- provided anyone gets interested -- but, I just wanted to put it out here because I've spent all day with it and I'm kinda excited about it, but it's late and it's way time for bed. Questions and Comments are welcomed..though I'll have more context once I explain some of the assumptions I've included in this.
__________________
Godfather of Fast-Sim OOTP My Mods: GMExcel 24 Major League Women's Baseball (OOTP24) quickstart Indian Premier League | 300+ years of baseball quickstart | Expatriate League quickstart | Off-Field Injuries Update | Women's Name File for OOTP | My (outdated) market calculator & financial spreadsheets Last edited by darkcloud4579; 10-29-2007 at 03:23 PM. |

|

|
|
10-29-2007, 02:26 AM
|
#2 |
|
Hall Of Famer
|
To make this work in the game, I set ticket prices in the game to $0, set media money to $0 for all teams and manually input the team's cash, budget and player salaries (based on average in the spreadsheet) at the end of each season prior to the start of free agency.
More information to come! |
|
|
|
|
10-29-2007, 08:17 AM
|
#3 |
|
Global Moderator
|
That looks interesting darkcloud. It looks like something that could possibly be automated in the long run - I've done that with Minor League finances before (set the leagues to be unaffiliated with one another but leave the teams affiliated - you can then turn financials on for the minors and set the relevant settings). I then wrote a bit of code to go through at the end of the year and 'move' all the costs and revenues from the minor league teams to their major league parent club. It seemed to work fine when I did it, but ended up with a lot of teams getting richer and richer (obviously with 5 or 6 additional revenue streams)
__________________
This signature is intentionally blank |
|
|
|
|
10-29-2007, 09:51 AM
|
#4 |
|
Hall Of Famer
|
Oh it would be a neat automated tool. And the spreadsheet needs to be cleaned up, I know. I just threw it together and was worried more about form over function. After all, I designed for myself and it wasn't intended to be shared. After I did it, I just realized it might be a good idea to share it with others.
__________________
Godfather of Fast-Sim OOTP My Mods: GMExcel 24 Major League Women's Baseball (OOTP24) quickstart Indian Premier League | 300+ years of baseball quickstart | Expatriate League quickstart | Off-Field Injuries Update | Women's Name File for OOTP | My (outdated) market calculator & financial spreadsheets |
|
|
|
|
10-29-2007, 10:18 AM
|
#5 | ||
|
Hall Of Famer
|
Here are the variables for the spreadsheet.
MARKET SIZE: Approx. population of the team's city. In the case of a city with more than one team, you can divide it however you see fit or find other mechanisms to account for the strength of a market (e.g. in my spreadsheet example, I gave the Yankees extra market area for parts of New York and Hartford) TICKET INCOME: This is the base ticket income number that where the average ticket price is $15 and takes 25% of the market size to determine the amount of ticket revenue the team generates. WIN PCT: Winning percentage for the current season (spreadsheet should be done at the end of the postseason before free agency for best results) RS-RA=RD (Runs scored - Runs Against = Runs Differential CP (Current Performance Factor) Takes Runs Differential and multiplies it by the team's winning percentage. PERFORMANCE INCOME: Attaches a dollar value using the performance factor. The presumption is, the more productive your team is, the more income you yield from this. CP X $100,000 BANDWAGON FACTOR: The bandwagon factor accounts for your team's success over the past four years (includes the current season. current season is multipled times four, last season by 3, 2 years ago by 2 and 3 years ago by 1, which are added together and then divided by six) BANDWAGON BONUS: Designed to reward teams that have had some measure of success. The most tweakable part of the formula, because it's subtracts the team's bandwagon factor from 750. Quote:
Quote:
The formula is: Code:
=IF(N9>0,N9*$100,000) OPENING PAYROLL: Payroll on opening day. SEASON END PAYROLL: Payroll at the last day of the regular season. I've also done it where I'll calculate the payroll figure the almanac records at the end of the season, but this is usually something I choose to do when first implementing the sheet, not after that usually. AVERAGE PAYROLL: Averages the two payroll numbers. This is the number I put into the game for team payroll. MEDIA $: My formula takes into account national media money, which I estimated at about $123.5 million per team, taking into account a recent -- but not the current -- MLB national media deal. I don't attempt in this particular calculation to account for internet or radio money. Local media money is also calculated at 40% of market size. This number is haphazard, but should intentionally benefit bigger market clubs. BUDGET: Revenue minues average payroll. THIS SEASON: I forgot to add this season's numbers to the bandwagon factor, hence, it gets pushed to the end of the spreadsheet. Oops. CASH: 35% of team budget. This is the available cash part I put into the game. AVAIL. BUDGET: Available budget used to end the spreadsheet and went into the game as the budget number for each team. I've tweaked the formula now, by adding a salary floor to it. It subtract budget from cash to get a number. But I've now added an average of all of the league payrolls to create a salary floor. It forces teams to spend at least the average amount of payroll. If payroll goes up across the league. It prevents teams from stockpiling cash from the TV deal, without improving their rosters, which OOTP AI inevitably does when you play solo for computer teams. The spreadsheet used to end here. The other elements are new and I haven't even implemented them in my own game yet. SDF: Sugar Daddy Factor is basically how many A-Rod's your rich owner can buy you. ($30 million per 1) I think I devised this fact to be no more than a factor of 1 and I'm still tweaking how this will work. I don't want it to be ridiculous, yet, I do want it to factor for an owner who has deep pockets and wants to win. Maybe it can be a regressive number over time. The rule of thumb for this particular area is this. Think of the 'owner' of the team. How many times could he literally for one year, dig down in his OWN pocket and pay $30 million. There just aren't a lot of people who could afford to do it, let alone be much less willing to do it. So this number shouldn't be that high. If you have an SDF over 3, then this dude must be a legit billionaire. And even then, anything over 5 and we're getting into Paul Allen/Bill Gates territory. Of course, if your team has a corporation as its owner, that could easily put the number over 5. CASH TOTAL: Your owner's contribution to the bottom line, plus team cash is how much cash you have at your disposal. I originally slated this for the cash area in the game. But until I tweak the sugar daddy factor..I wouldn't do that with it, because it'll be a lot of money. Which is okay, I guess. But could skew the model quite a bit, depending on what your intent is. MMB: (Market Maximization Bonus) Basically, if you're over .500, you get more ticket money. You get takes 35% of the market and the average ticket price is $50. Benefits bigger markets obviously, but can be vital to the survival for a small market team's sustained success. FINAL BUDGET: In my spreadsheet this isn't complete and so, if you look at it and see all of the negative numbers, it's because I haven't accounted for owner strength throughout my league yet. TOTAL AVAILABLE: This will be the new number that we'll put into the team budget area in the game. I figured this out after playing around the model a bit, because this is how OOTP interprets it, so it has to be this way. Don't worry about my semantics, just appreciate the end result. Last edited by darkcloud4579; 11-01-2007 at 01:23 AM. |
||
|
|
|
|
10-29-2007, 03:23 PM
|
#6 |
|
Hall Of Famer
|
I've updated it a bit after posting the descriptions.
Some thing else to consider is that I'm really adamant about having some teams in financial straits. I don't like to have leagues where all of the teams are doing well all of the time financially. This model makes it a little fairer than just haphazardly doing it in my head, but...the notion is, if teams --especially in poorer markets -- aren't doing as well for a sustained period of time, they'll keep running losses and have to either drop salary to stay competitive or move to a bigger market. So if your premise or ideas aren't the same, you'll probably find this model to offend your sensibilities. But if you look at my particular examples, the teams that are in debt, are ballclubs that severely need to cut payroll. The areas in the spreadsheet now in black, are inputted into the game. I'm going to play around more with colour codes and come up with other ways to make it easier to read and eventually, put the fields in order calculation wise. But not unless it proves useful to somebody. Last edited by darkcloud4579; 10-30-2007 at 12:19 AM. |
|
|
|
|
10-29-2007, 04:09 PM
|
#7 |
|
Hall Of Famer
|
You can include regional TV networks (NESN, YES) into the sugar daddy factor, too. It seems to work well for me.
This model seems to really penalize teams that have bloated payrolls and that fail to win over a period of time. I mean, it hits them HARD. I didn't even attempt to do that, it just is a side effect of it all. Last edited by darkcloud4579; 10-30-2007 at 12:02 AM. |
|
|
|
|
10-30-2007, 12:19 AM
|
#8 | |
|
Hall Of Famer
|
Here's version 1.5:
Basically, here's what we've done. I've added a model for subsequent seasons. There is a new area called "Leftover Cash" which is basically a way to ensure that teams can carry over money they've earned in some form or fashion from year to year. It's not a direct calculation or anything, it's simply a residual amount of income related to the bandwagon factor, plus the sugar daddy income the team draws. After year one of using the model, you input the "leftover cash" in the cash box in OOTP, rather than using the cash total area in the sheet. The thing is, you're still allowed that sugar daddy money. It's just factored in differently and not as "liquid" as it was before. The other big change in this version is that the bandwagon factor is more inclusive. I felt it penalized teams that had one bad season over a span of four and to me, that's a little steep. So I've lowered it to where...well, here's an example. One particular team won x number of games... Quote:
So it's undoubtedly more forgiving than before, but I think that can prove to be a good thing and it makes teams rely less on a deep pocketed owner or a huge market to be able to withstand a few bad years that maybe they're rebuilding or something. So there you go. Last edited by darkcloud4579; 11-01-2007 at 01:06 AM. |
|
|
|
|
|
10-30-2007, 07:58 AM
|
#9 |
|
All Star Reserve
Join Date: Sep 2005
Posts: 704
|
Don't have excel, any way I can use this?
|
|
|
|
|
10-30-2007, 08:10 AM
|
#10 | |
|
Hall Of Famer
|
Quote:
__________________
Godfather of Fast-Sim OOTP My Mods: GMExcel 24 Major League Women's Baseball (OOTP24) quickstart Indian Premier League | 300+ years of baseball quickstart | Expatriate League quickstart | Off-Field Injuries Update | Women's Name File for OOTP | My (outdated) market calculator & financial spreadsheets |
|
|
|
|
|
11-01-2007, 01:09 AM
|
#12 |
|
Hall Of Famer
|
Version 2.0
I've updated the model.
All of the above functions still exist. They're in a more logical order now, so it should be easier to input/replace data as you use it. The black areas with white text are the ones that go into OOTP. The only new area I've added is one called "Franchise Value." It's a number that attempts to capture how much your franchise is worth, basing it partially on market size, team's financial health and relative success. It's really just a "gee whiz" sort of thing, but can be a fun little addition I think. The areas highlighted in orange are the ones you input information for (as based on the descriptions above), the others are calcuated for you based on that information. Last edited by darkcloud4579; 11-01-2007 at 01:30 PM. |
|
|
|
|
11-01-2007, 12:20 PM
|
#13 |
|
Hall Of Famer
|
Version 2.2
Additions:
- Added a valuation rank to see how your team's value stacks up with other clubs - Added a payroll rank to see how your team's payroll stacks up - Added a color coded key to help navigating the spreadsheet better. Here are some screenshots. 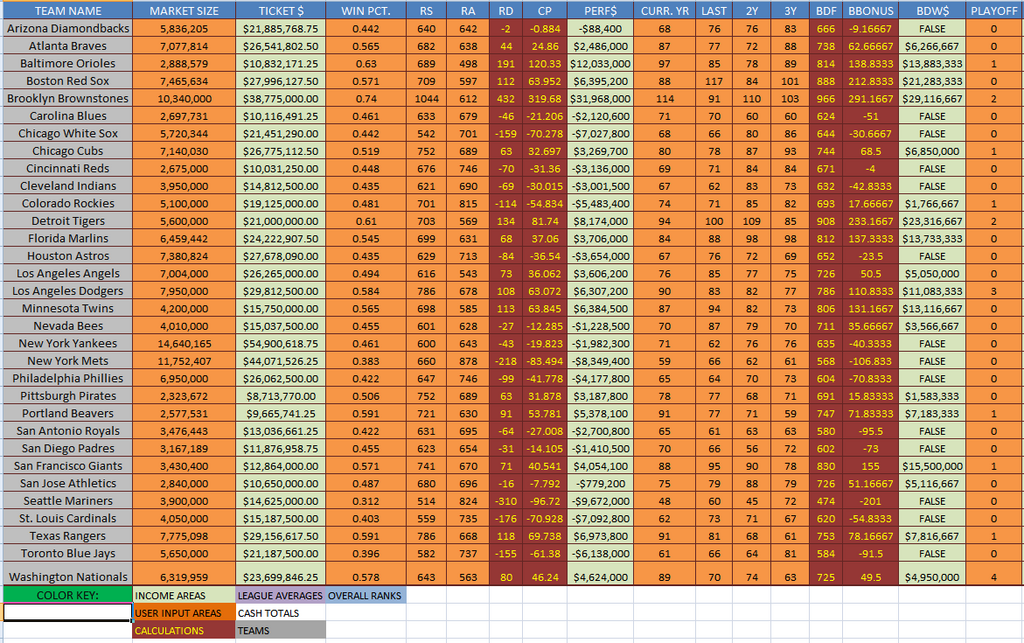 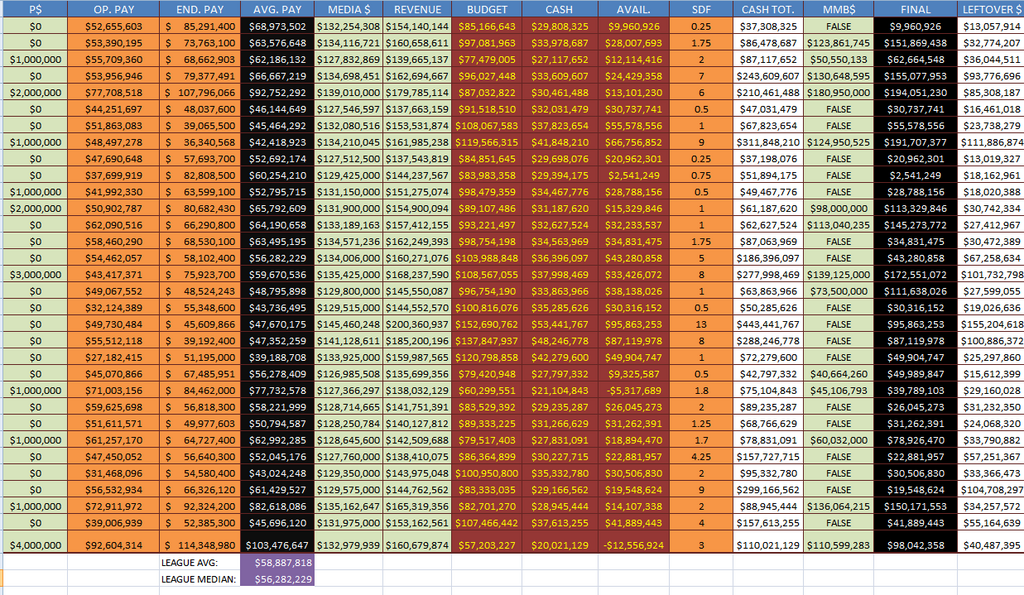 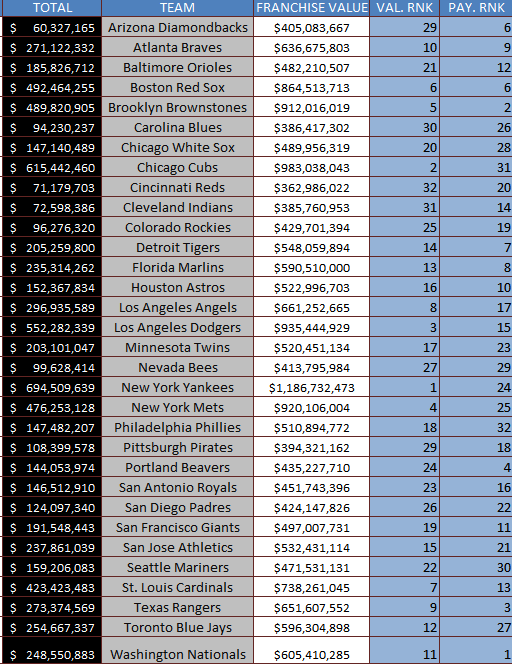
Last edited by darkcloud4579; 11-04-2007 at 11:12 PM. |
|
|
|
|
11-01-2007, 12:31 PM
|
#14 |
|
All Star Reserve
|
I realize that you put a serious effort into the spreadsheet. But could you describe which values are entered where in an OOTP league setup and when (start of season or start of free agency). I know the OOTP produced financial values are more or less random, but could you explain in more detail what the advantages of your system are. Doesn`t OOTP override entered numbers after each seson or when a medis contract has run out?
|
|
|
|
|
11-01-2007, 01:44 PM
|
#15 | |||
|
Hall Of Famer
|
Quote:
I would input the information at the start of free agency each year. And you do it every season, to counteract what OOTP does with the financials. The newest one is colour coded and indicates what areas that you need to put into OOTP. It's just the black areas. Quote:
The only areas you want to fill out are: Cash, Budget and Player Expenses in the Options and Ballpark menu in the game. AVG. PAY: This amount gets entered into the "Player Expenses" area in the game. FINAL: Gets entered into "Cash" area in the game. TOTAL: Gets entered into the "Player Expenses" area in the game. Quote:
It's mostly about market size, but other variables including how rich your own is, how much local media revenue your team brings in, team success and fan support are ALL embedded into my module. So basically, rather than use the in-game financial system, using mine will give teams a realistic budget each year and you'll never have to worry about the arbitrary nature of the game's system, if it's important for you to have a league that mirrors real-world financials. If someone was a solo player who didn't care about the financial aspects or didn't want to have to 'maintain' the financials for the entire league, I can see where this model wouldn't be one that would work for them. On the same token, I don't see any reason that one person could use it for say, only their team and let the rest of the league run on the OOTP system. It wouldn't be super realistic since part of the model is dependent on league average salary information, but besides that..it'd be doable. Hope that helps or if you want to know anything else or specific methodology questions, lemme know. |
|||
|
|
|
|
11-01-2007, 11:43 PM
|
#16 |
|
Hall Of Famer
|
I can confirm that you can indeed run this model by only using your own team and not bothering with the others information. The only information that's dependant on other teams is the budget information to get an average budget number, but provided you have one once -- or just multiply the league average budget times 25 or 40 -- you can do that to make it work, too and with that number, you can use the spreadsheet just for your own team, inputting their values from season to season (after the regular season ends is when all of the changeover happens) and let the rest of the league run as normal.
It almost acts as a house rule, especially if you're in a smaller, less dynamic market and want realistic results. |
|
|
|
|
11-04-2007, 11:11 PM
|
#17 | ||
|
Hall Of Famer
|
Version 3.0
Additions
Quote:
So, I decided to try to make it a bit easier to use and to 'project' out for the next five years how much money your team will have to spend and to consider all of the other factors that are incorporated into this. So there is a new section now that creates budgets for the team for the next five years (presumably from the off-season you're inputting information until the fifth year of that stretch.) 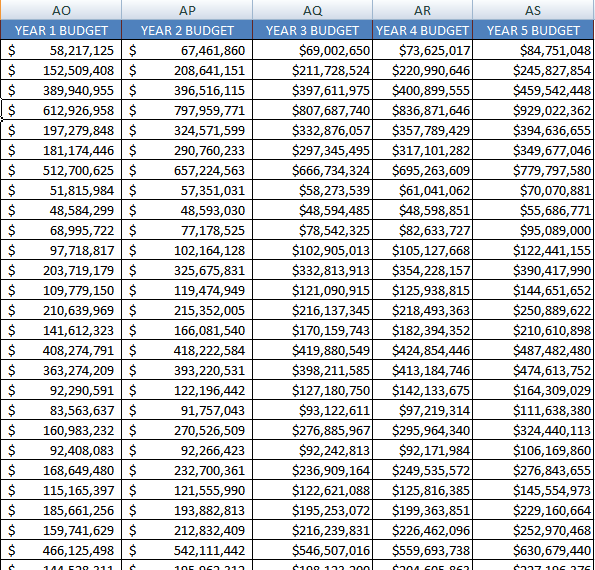 This is more realistic, because it's like any other business, where you'd project out your finances over a period of time, rather than doing it each year on the fly. The other thing to note is, if you use the numbers I have in the spreadsheet for media money, it's obviously tilted towards a league with a lot more money in it, to simulate what real life is like, rather than a league with more modest numbers. To tweak it for a more modest league, simply change the MEDIA$ number. It's currently assumes that every team in the league gets $123.5 million per year from all national media. Local media is also factored in some, but if you lower that national media number across the board, it'll give you far more sensible numbers across the board if you're one that prefers to deal in smaller cash figures (or in case you want to jack it up.) The formula is =SUM(123500000)+(0.4*C7), all you change in that formula is the 1235...part, as that's the money part and then copy/paste it to all of the fields in that particular row to have all of the teams follow that amount provided that's what you want to do. I've also added a new section for home record/away record and what amounts to "home field advantage" and what it does is, gives the team an amount of money for "suite revenue" or season ticket revenue for having a better record at home. Mostly because it just means that the team gets some sort of "boost" from playing in front of the home crowd. But the bottom line is, if you complete the spreadsheet once, you can operate for five years using the budget numbers and that ought to make things a lot simpler to use. All in all, it's a really flexible, tweakable -- but indeed time intensive to some degree -- financial model. I hope you like it or find as much for it as I have. Ok, so to summarize... Quote:
Again, you can just do this for your own team and let the OOTP teams operate on their own financial system if you choose. It's far from the most realistic way to do it and it won't maximize the value of using this tool, but...it's completely up to you. Last edited by darkcloud4579; 11-28-2007 at 02:02 AM. |
||
|
|
|
|
11-05-2007, 05:00 AM
|
#18 |
|
Hall Of Famer
Join Date: Jan 2003
Location: Frankfort, Kentucky
Posts: 3,739
|
Darkcloud, are you on the beta team for next year? Regardless, I hope you can get battists and markus' attention. An in-game feature that generates this level of detail would be a fantastic new development for OOTP.
The game, the engine, historic stats, etc. were fixed phenomenally in OOTP 2007. The next, greatest challenge is getting the front office finances to take into account market sizes, payrolls, etc. to the incredible extent that you've tried to model.
__________________
Charlie Root won more games for the Cubs than any pitcher (201), yet was remembered for one pitch to Babe Ruth. Find out more about the 1929 World Series in my book, "Root for the Cubs: Charlie Root and the 1929 Chicago Cubs." See the web site at www.rootforthecubs.com. The book is at http://www.amazon.com/Root-Cubs-Char...t+for+the+cubs. Beta tester, OOTP 2007-2023 and iOOTP 2011-2014. |
|
|
|
|
11-05-2007, 07:30 AM
|
#19 |
|
Hall Of Famer
|
Yes, I am on the beta team for next version. And I'll bring this up. I never thought to do it, but...you make a good point that they ought to at least see it. Thanks.
__________________
Godfather of Fast-Sim OOTP My Mods: GMExcel 24 Major League Women's Baseball (OOTP24) quickstart Indian Premier League | 300+ years of baseball quickstart | Expatriate League quickstart | Off-Field Injuries Update | Women's Name File for OOTP | My (outdated) market calculator & financial spreadsheets |
|
|
|
|
11-12-2007, 09:55 PM
|
#20 |
|
Hall Of Famer
|
Howdy.
I'm still using this, but the latest version pitches a lot of the assumptions that the old uses and is almost completely different in the way its modeled. I'm going to use it for a few more years and get it really down pat before I decide to release it. The new way I use the model is mostly as a mechanism for assessing the financial health of teams and to be less a tool that needs to be updated each year and rather, one that can be used to model your team's finances for a five-year period, so that it's a lot less work and you don't have to open it every season to do stuff. And it'll basically have two different main functions. The first will be to model the financials based on actual market size better and the second part is to assess where your team sits in a 'real life' economic environment, so you know what the value of franchises are over time. I'll see how it continues to work for me and eventually, I'll let you all see if there is interest. Thanks. |
|
|
|
 |
| Bookmarks |
|
|


