 |
|
Latest News:
OOTP 27 Buy Now
- FHM 12 Available
- OOTP Go! 27 Available
Out of the Park Baseball 27 Buy Now! |

|
|
||||
| ||||
|
|||||||
| OOTP 26 - General Discussions Everything about the brand new 26th Anniversary Edition of Out of the Park Baseball - officially licensed by MLB, the MLBPA, KBO and the Baseball Hall of Fame. |
 |
|
|
Thread Tools |
 04-15-2025, 11:35 AM
|
#21 |
|
Minors (Rookie Ball)
Join Date: Oct 2018
Posts: 31
|
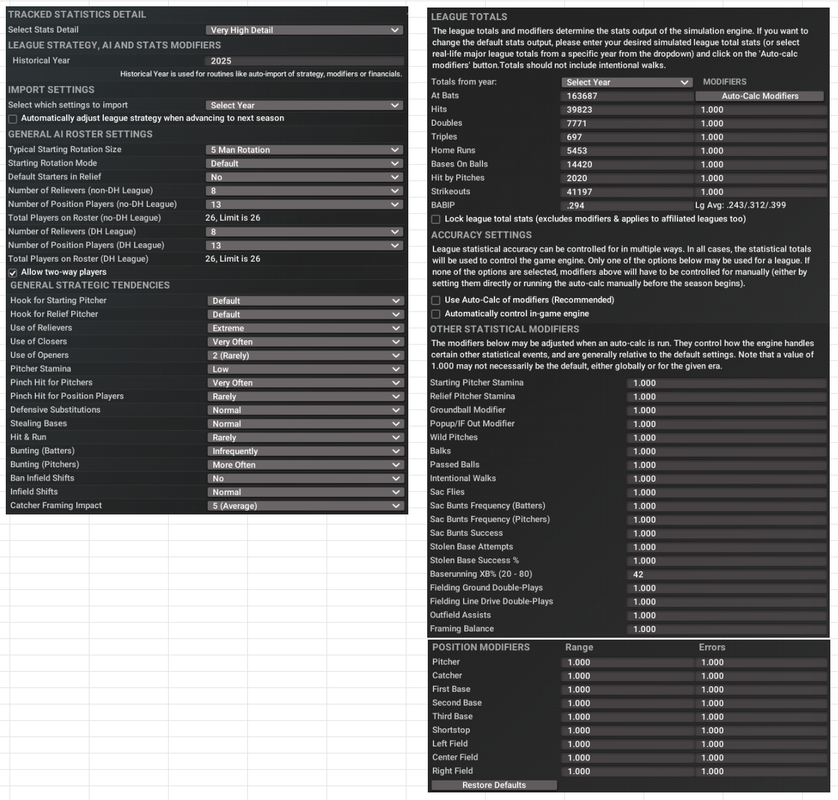
I've posted below the settings I used in the test league that generates the results above.
Some observations: - These ought to convert to WAR estimates with a runs-per-win constant of something like 10 (so shortstop IF range 38.3 runs is about 3.83 WAR) - BUT replacement level and 50-rated everything is not the same - the replacement level SS on my waiver wire in a MLB save is rated something like 55 not 50 - I'm surprised by the range results at 2B (too uniform vs my prior expectations) and RF (too low) - I'm aware the 1-250 scale is more granular than 20-80 but I prefer the immersion of sticking to 20-80 Last edited by squirrel; 04-15-2025 at 11:40 AM. |

|

|
|
04-15-2025, 11:37 AM
|
#22 |
|
Minors (Rookie Ball)
Join Date: Oct 2018
Posts: 31
|
|
|
|
|
|
04-15-2025, 12:06 PM
|
#23 |
|
Minors (Rookie Ball)
Join Date: Oct 2018
Posts: 31
|
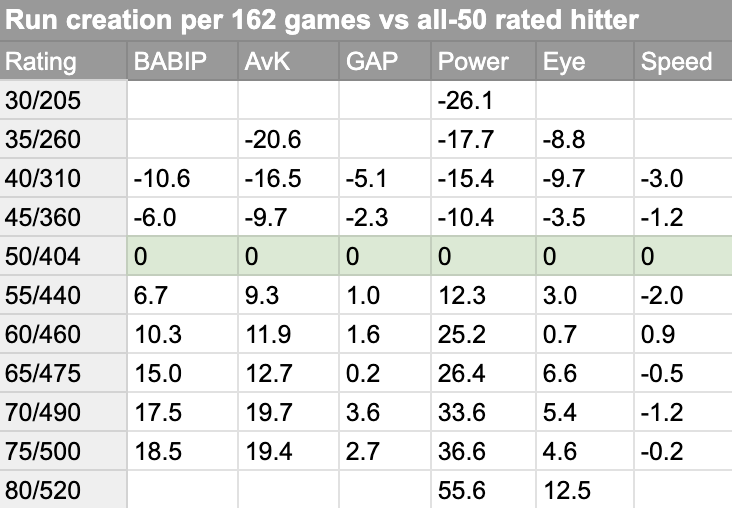
Another observation - the team with all-50 rated hitters that faced the all-50 defense had runs per 162 games within +/- 2 runs of the mean in 80% of 100+ simulations of 100k games...I take that to mean variances within 4 runs in the table above could entirely be down to randomness and not underlying player skill flowing through from the ratings IYSWIM
|
|
|
|
|
04-15-2025, 12:39 PM
|
#24 |
|
Minors (Rookie Ball)
Join Date: Oct 2018
Posts: 31
|
Same idea but for hitters:
|
|
|
|
|
04-15-2025, 02:05 PM
|
#25 |
|
Minors (Triple A)
Join Date: Mar 2011
Posts: 233
|
*Fielding DRS Stats*
This is great. It seems to prove the established wisdom. There are a couple that surprise me if I'm reading this correctly. Often, you see a player that has a great infield profile except for a weak arm almost always shoehorned into 2B. It appears here that arm is far more significant to 2B than SS? Of course, assuming I had the range and error ratings, I'd still make more of an impact at SS, but arm isn't that impactful. It's as impactful as 3B from 2B! This literally makes me wonder if there's something wrong in the engine? Is throwing out runners from C related to the relatively low amount of SB in a modern environment? Last edited by Guthrien; 04-15-2025 at 02:07 PM. |
|
|
|
|
04-16-2025, 01:31 AM
|
#26 | |
|
Minors (Rookie Ball)
Join Date: Oct 2018
Posts: 31
|
Quote:
1. The 2B numbers look odd so I will revisit them in case something obvious I have done wrong in the analysis (typos etc) 2. Generally, except for SS and CF and maybe 2B I think I probably have overvalued defense and need to be more bat-first when I play OOTP from here on in |
|
|
|
|
|
04-16-2025, 09:41 AM
|
#27 |
|
Minors (Triple A)
Join Date: Mar 2011
Posts: 233
|
I think #2 is, without question, true. I think it was already generally accepted that C has been gradually degraded in defensive importance and therefore could be less stressed in the 'defensive center' strategy. Not that there are endless offensive options at that position, but there are enough at all the others you would be leaving wins on the table.
|
|
|
|
|
04-16-2025, 11:29 AM
|
#28 | |
|
Minors (Rookie Ball)
Join Date: Jan 2022
Posts: 22
|
Quote:
Last edited by perfektootp; 04-16-2025 at 11:31 AM. |
|
|
|
|
|
04-16-2025, 12:58 PM
|
#29 |
|
Minors (Rookie Ball)
Join Date: Oct 2018
Posts: 31
|
Good question and one I don't have much of an answer to. I don't know how these numbers work or how much of a difference they make.
I think if I did this again I would try to set them to be identical to my MLB sim but I can see that these numbers move around from season to season and I don't think I understand the distributions of these numbers i.e. how they vary from year to year. |
|
|
|
|
04-16-2025, 02:38 PM
|
#30 |
|
Minors (Rookie Ball)
Join Date: Oct 2018
Posts: 31
|
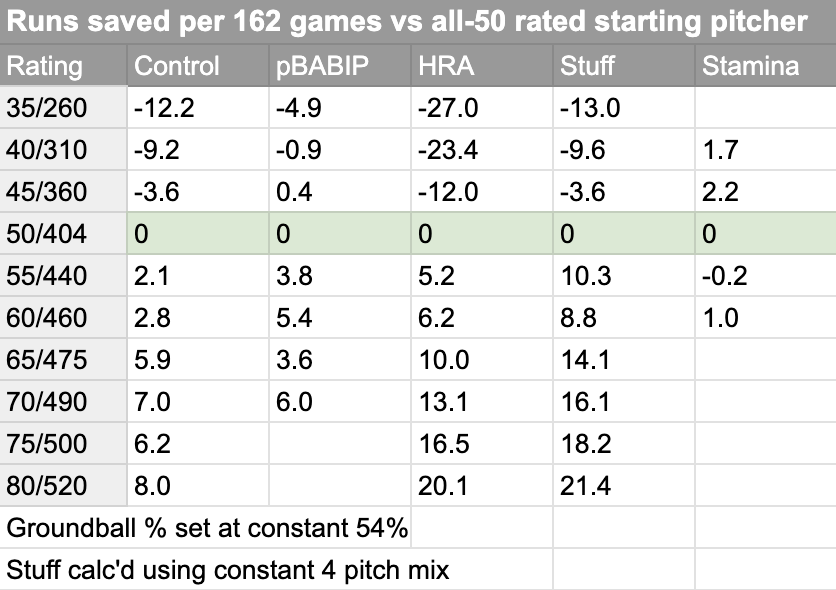
Now done the pitchers - same idea, all pitchers and hitters set to 50 everything, then varied the #1 starting pitcher for Team A, one rating at a time
|
|
|
|
|
04-17-2025, 10:31 AM
|
#31 |
|
Hall Of Famer
Join Date: May 2011
Posts: 3,133
|
Thanks for publishing all this.
For defensive ratings, it's worthwhile to look at ratings below 50 (or 55) as well just to see the full spread of how many runs you lose by running out a terrible defender. In looking at this in OOTP 25, there were definitely some lower and upper bounds where it really didn't matter much if you were a 20 vs 30 range defender, or a 70 vs 80 range defender. This reddit post comments on this phenomenon as well: https://www.reddit.com/r/OOTP/commen...ue_in_ootp_25/ From my defensive testing (which was done similarly, creating an "average" defensive team and then adjusting one variable and running 16200 games in the simulation module) I found the following spread from worst-to-best (e.g. how many runs different from a 20 to an 80) for these variables, measured in runs per season for a starter: C Framing 30 C Arm 30 2B Range 45 (with essentially no benefit beyond 65 range) 2B Arm 15 2B DP 35 3B Range 20 3B Arm 15 SS Range 50 (no benefit beyond 70) SS Error 10 SS DP 15 LF Range 40 (no benefit beyond 65) LF Arm 10 CF Range 60 (no benefit beyond 65) CF Arm 25 RF Range 30 (no benefit beyond 55) RF Arm 15 I also found that these were cumulative, so if you stacked a good range and a good arm that it would lead to even better results for that player. I would also emphasize that these findings are all in a very artificial testing environment. HOWEVER- in practice, I also found that it was extremely difficult to use these numbers, because "real life" OOTP teams have such varied defenses and you aren't comparing to 50 or 55. Not to mention that for many players in practice, they might have 70 range but not be maxed out on experience at the position, which impairs their performance. So in modeling defense for my projection system, I actually found it considerably simpler (and reasonably accurate) to just base it on the position ratings rather than the individual component ratings. This was all calculated in OOTP 25 in a "real life" league, essentially figuring out how many runs per game a 25 SS vs a 55 SS would end up with in ZR (and incorporating arm and benefit to runs allowed for catchers). The position ratings are heavily driven by range anyway, which is the most important component. I found that from a 20 to 80 defender you would end up with the following ranges of values, in terms of runs per inning, from worst to best: C .039 (53 per 150 games/1350 innings) 1B .009 (12) 2B .033 (45) 3B .025 (34) SS .045 (61) LF .024 (32) CF .040 (54) RF .028 (38) In most cases, the "cut point" for where a player is accruing positive defensive value is around 55- so a player less than 55 at that position will end up with negative defensive value, while a player above that will end up with positive value. Of note, this is likely not true in an online league where savvy players are not running out 40 center fielders and are prioritizing good defensive players- in that setting, you probably need at least 60-65 at a position to end up with positive defensive value. |
|
|
|
|
04-17-2025, 11:19 AM
|
#32 | |
|
Bat Boy
Join Date: May 2020
Posts: 5
|
Quote:
1B #1: 50 skill 1B #2: 60 skill CF #1: 45 skill CF #2: 65 skill How would the above translate to runs / WAR? EDIT: Not sure if my math is right here, but assuming that a 80/80 catcher would be worth +53 runs (and 5.3 wins), and a 20/80 catcher would be worth -53 runs (and -5.3 wins), I come up with the following: 1B, 50 skill: 0 WAR (Replacement Level) 1B, 60 skill: 0.4 WAR CF, 45 skill: -0.9 WAR CF, 65 skill: 2.7 WAR EDIT 2: Unless my math is wrong. It looks like if I take 1,350 innings and divide by 53, I get 0.039. So that indicates the range difference between a 20 and 80 catcher. Since this is a bell curve, does that mean you can have +26.5 runs at the top (+2.6 wins), and -26.5 runs at the bottom (-2.6 wins)? Last edited by drzaius; 04-17-2025 at 01:21 PM. Reason: Added some math; edit 2: math is wrong? |
|
|
|
|
|
04-17-2025, 02:33 PM
|
#33 | |
|
Minors (Rookie Ball)
Join Date: Oct 2017
Posts: 29
|
Quote:
|
|
|
|
|
|
04-17-2025, 10:24 PM
|
#34 | |
|
Hall Of Famer
Join Date: May 2011
Posts: 3,133
|
Quote:
The other piece that is confusing and very difficult to understand is the positional adjustments and replacement level calculations- which you really need to look at https://library.fangraphs.com/misc/war/ or a similar source to understand in detail. I used the values from Baseball Reference for positional adjustments (slightly different from the ones you get on Fangraphs), and the upshot is that an average-fielding center fielder is more valuable than an average-fielding first baseman. Which is intuitively obvious, but you need to have a standard for it. So a league-average hitter who plays an average-fielding first base will end up being a less-than-average player (ending up around 1.0 WAR on a full season), while a league-average hitter who plays an average-fielding shortstop will end up being a better-than-average player (ending up around 2.7 WAR). I'd say that based on these numbers, that the difference between a 50 and 60 defensive first baseman is about (0+.003)*1350=4 runs per year (0.4 WAR), and the difference between a 45 and 65 defensive center fielder is about (.014+0.08)*1350=30 runs per year (3.0 WAR). Hope that helps and doesn't further confuse things... Last edited by jaa36; 04-17-2025 at 10:27 PM. |
|
|
|
|
|
04-22-2025, 11:18 PM
|
#35 |
|
Minors (Rookie Ball)
Join Date: May 2016
Posts: 22
|
Hi,
Just installed the tool tonight, very cool. I am having one small issue, I didn't know if you'd seen during your setup. I am running into it showing my best players as only capable of a negative WAR(not just my players). I must have done something incorrect. For example, Elly De La Cruz at -3.3 WAR https://imgur.com/a/SHXkwWb Any guidance you could provide would be greatly appreciated! Last edited by trence; 04-22-2025 at 11:36 PM. |
|
|
|
|
04-23-2025, 10:32 AM
|
#36 | |
|
Minors (Double A)
Join Date: Jun 2011
Posts: 111
|
Quote:
|
|
|
|
|
|
04-23-2025, 07:50 PM
|
#37 | |
|
Minors (Rookie Ball)
Join Date: May 2016
Posts: 22
|
Quote:
|
|
|
|
|
|
04-23-2025, 09:40 PM
|
#38 | |
|
Minors (Rookie Ball)
Join Date: May 2016
Posts: 22
|
Quote:
Ran it multiple times, and im getting the same values. -3.22 for Elly. That makes me think I'm doing something wrong consistently. I use 0-100, could that be an issue? Last edited by trence; 04-23-2025 at 10:24 PM. |
|
|
|
|
|
04-23-2025, 10:21 PM
|
#39 | |
|
Minors (Double A)
Join Date: Jun 2011
Posts: 111
|
Quote:
|
|
|
|
|
|
04-23-2025, 10:56 PM
|
#40 | |
|
Minors (Rookie Ball)
Join Date: May 2016
Posts: 22
|
Quote:
|
|
|
|
|
|
| Bookmarks |
|
|


