Taking a look now, at these same metrics: Total Average Revenue, Total Average Payroll, Total Average Budget per year, by league.


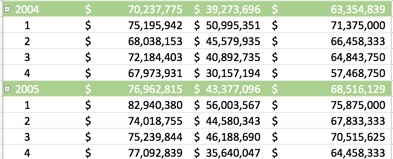
The first thing that strikes me is the almost negligible difference in average revenue by league year over year. Maybe 1% difference between the top league and bottom for the first few years. By the last year of our sim, there's still only a 7% difference between the top and bottom leagues in terms of revenue. Again, we designed this so that there would be a 90% diff.
If we look at player payroll, we see that things are similar. Discounting year 1 and the first few years, we see that top league has a slightly higher average payroll over the sim, but not quite what I was expecting. By 2002, there's a spread of about $15M in payroll - the lowest league being about 67% of the highest. By the end of our sim, the spread is $20M or 63%.
Average League Budgets follow the same general trend as payroll. After being indistinguishable for the first few years, by the halfway point of the sim, the lowest league is 68% of the highest league. Things start skewing the other way by the end of the sim, where the lowest league ends with an average budget 84% of the highest league.
Why does this happen? My guess is that it has to do with revenue. It's going to be hard to maintain a real stratification between leagues if their revenue is so similar.
Next post will look at the factors that make up the revenue.