Additions
Quote:
- New five-year budget cycles for teams
- Revenue model is tweaked to ensure financial solvency given normal conditions
- Additional ticket revenue for success at home factored in
- Market Maximization Bonus afford to all teams, to provide more realistic ticket revenue numbers.
|
The most annoying I've found recently is how annoying it is to constantly input data for a big league - or heck, a small one - because there are so many values that you need to put in, etc and it can get on one's nerves and make you just want to say "screw it" and use the game's ineffective method instead.
So, I decided to try to make it a bit easier to use and to 'project' out for the next five years how much money your team will have to spend and to consider all of the other factors that are incorporated into this.
So there is a new section now that creates budgets for the team for the next five years (presumably from the off-season you're inputting information until the fifth year of that stretch.)
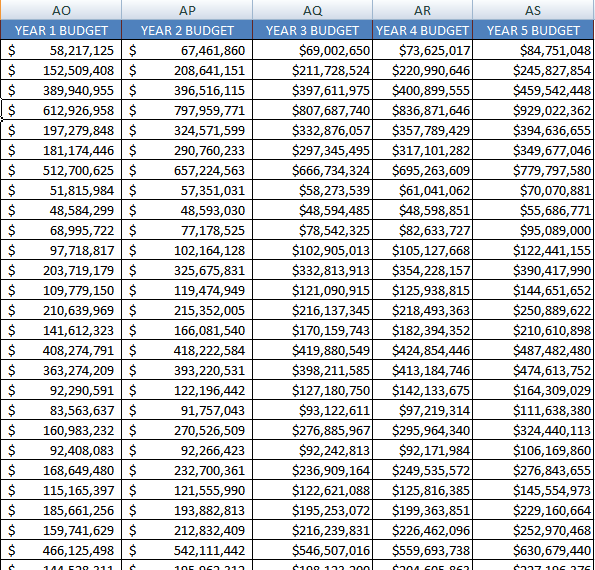
This is more realistic, because it's like any other business, where you'd project out your finances over a period of time, rather than doing it each year on the fly.
The other thing to note is, if you use the numbers I have in the spreadsheet for media money, it's obviously tilted towards a league with a lot more money in it, to simulate what real life is like, rather than a league with more modest numbers.
To tweak it for a more modest league, simply change the MEDIA$ number. It's currently assumes that every team in the league gets $123.5 million per year from all national media. Local media is also factored in some, but if you lower that national media number across the board, it'll give you far more sensible numbers across the board if you're one that prefers to deal in smaller cash figures (or in case you want to jack it up.)
The formula is =SUM(123500000)+(0.4*C7), all you change in that formula is the 1235...part, as that's the money part and then copy/paste it to all of the fields in that particular row to have all of the teams follow that amount provided that's what you want to do.
I've also added a new section for home record/away record and what amounts to "home field advantage" and what it does is, gives the team an amount of money for "suite revenue" or season ticket revenue for having a better record at home. Mostly because it just means that the team gets some sort of "boost" from playing in front of the home crowd.
But the bottom line is, if you complete the spreadsheet once, you can operate for five years using the budget numbers and that ought to make things a lot simpler to use.
All in all, it's a really flexible, tweakable -- but indeed time intensive to some degree -- financial model. I hope you like it or find as much for it as I have.
Ok, so to summarize...
Quote:
if you prefer to use the five-year projections model, you'll input the following numbers at the end of the post-season:
In the CASH area of OOTP, input the amount from the LEFTOVER section of the spreadsheet.
In the BUDGET area of OOTP, input the amount from the YEAR x BUDGET that you're inputting for. So if it's the 2nd year of your budget year, put that number in.
In the PLAYER EXPENSES area of OOTP, input the budget amount from the team almanac page for that season into the OP. PAY part of the spreadsheet and enter the amount from the player payroll part of the OOTP front page tab in the team menu, into the END. PAY and then input the AVG. PAY number into the PLAYER EXPENSES area in OOTP.
|
That's it. Rinse, wash and repeat for each year.
Again, you can just do this for your own team and let the OOTP teams operate on their own financial system if you choose. It's far from the most realistic way to do it and it won't maximize the value of using this tool, but...it's completely up to you.