I've got an online league with three separate leagues in an association. It's promotion-relegation, but done manually, not with OOTP.
The top tier has higher reputation than the middle tier, and the lower tier is slightly lower.
I'm seeing issues where players in the top tier are asking for extensions far below what they would get on the open market, by many millions.
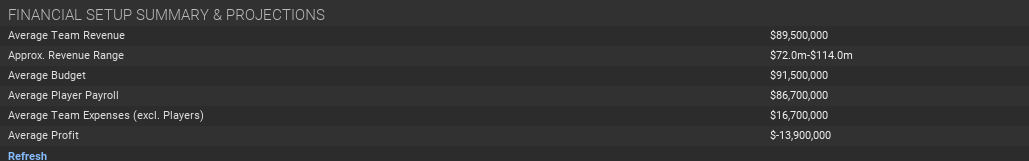
I've looked at everything I can to try and adjust it, but nothing seems to help. One thing I noticed when looking at the projected financials is that the top tier has some really whacked projections for average team revenue and profit, but the two other leagues do not.
Top tier looks like this:

Middle tier looks like this:
Nothing looks "off" about any particular team's revenue, or profit - see
https://www.usba14.us/reports/league...al_report.html
To me, the numbers are so off it looks like some kind of overflow issue, otherwise it makes no sense that all the numbers in the millions turn into negative $2B.
I'm not sure this is causing the issues I'm seeing with players asking for low contracts, but it seems wrong nonetheless.
Happy to share any other information about the league setup if it would help get some suggestions on how to fix the projections.